

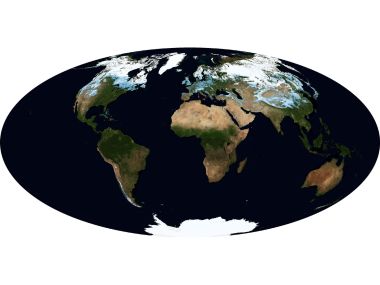
This is a panoramic visualization map of global Normalized Difference Vegetation Index generated from satellite remote sensing data, using elliptical projection to show the full appearance of the Earth. Dark blue areas represent oceans, different shades of green correspond to vegetation coverage density, light beige areas are sparse vegetation deserts, light gray areas are polar ice caps. It is a professional geographic popular science material showing global vegetation distribution.
Global Vegetation Distribution Satellite Remote Sensing Map
1
0
0
0
📁 Also featured in1

🔗 Repost
✍️ Author猫猫壁纸酷
🔗 Source URLwww.wallcoo.com


Comments 0